> ## Documentation Index
> Fetch the complete documentation index at: https://docs.fermata.run/llms.txt
> Use this file to discover all available pages before exploring further.
# Project analytics
> Fermata reads your own local Claude transcripts to show what actually happened per project: tokens, model mix, tool usage, and how much ran on its own.
Fermata reads your own local Claude transcripts to show you what actually happened, per project: tokens, which models ran, which tools were used, and how much of the work ran on its own. It is on-device and plan-agnostic.
It lives on [Home](/surfaces/home), under the **Analytics** tab.
## Usage and mix
The dashboard reports over a time range you pick: **Last 7 days**, **Last 30 days**, or **Last 90 days**. Within that window it shows:
* "Sessions run" and "Pieces completed", each against the previous window.
* "Tokens", "Cost", and "Tool calls". Cost is an estimate at list price, so a subscription plan is never billed that figure.
* "Activity", the work per day over the window.
* "Models", the token mix across the models you ran.
* "Tool Usage", the breakdown by kind.
* "Autonomy", covered below.
The cost of one piece, split by phase, is one click from that piece's "Usage" card in the inspector, behind **Breakdown by phase**; the figure includes the nested subagents it spawns, so the number reflects the true cost of the feature, not just the top-level agent. See [cost and usage](/reference/cost-and-usage) for that card and the "Spend by phase" sheet.
Below the charts, Pro adds four spend cards for the whole project:
* **"Spend by phase".** The project's spend split across the same lanes as the piece sheet, Spec through Unattributed; lanes with no spend are omitted.
* **"Top spenders".** Which pieces cost the most; a row opens that piece's "Spend by phase" sheet.
* **"Cost per piece".** What an average piece costs, and which way it is trending.
* **"Rework tax".** What share of the spend went into feedback rounds and redo work.
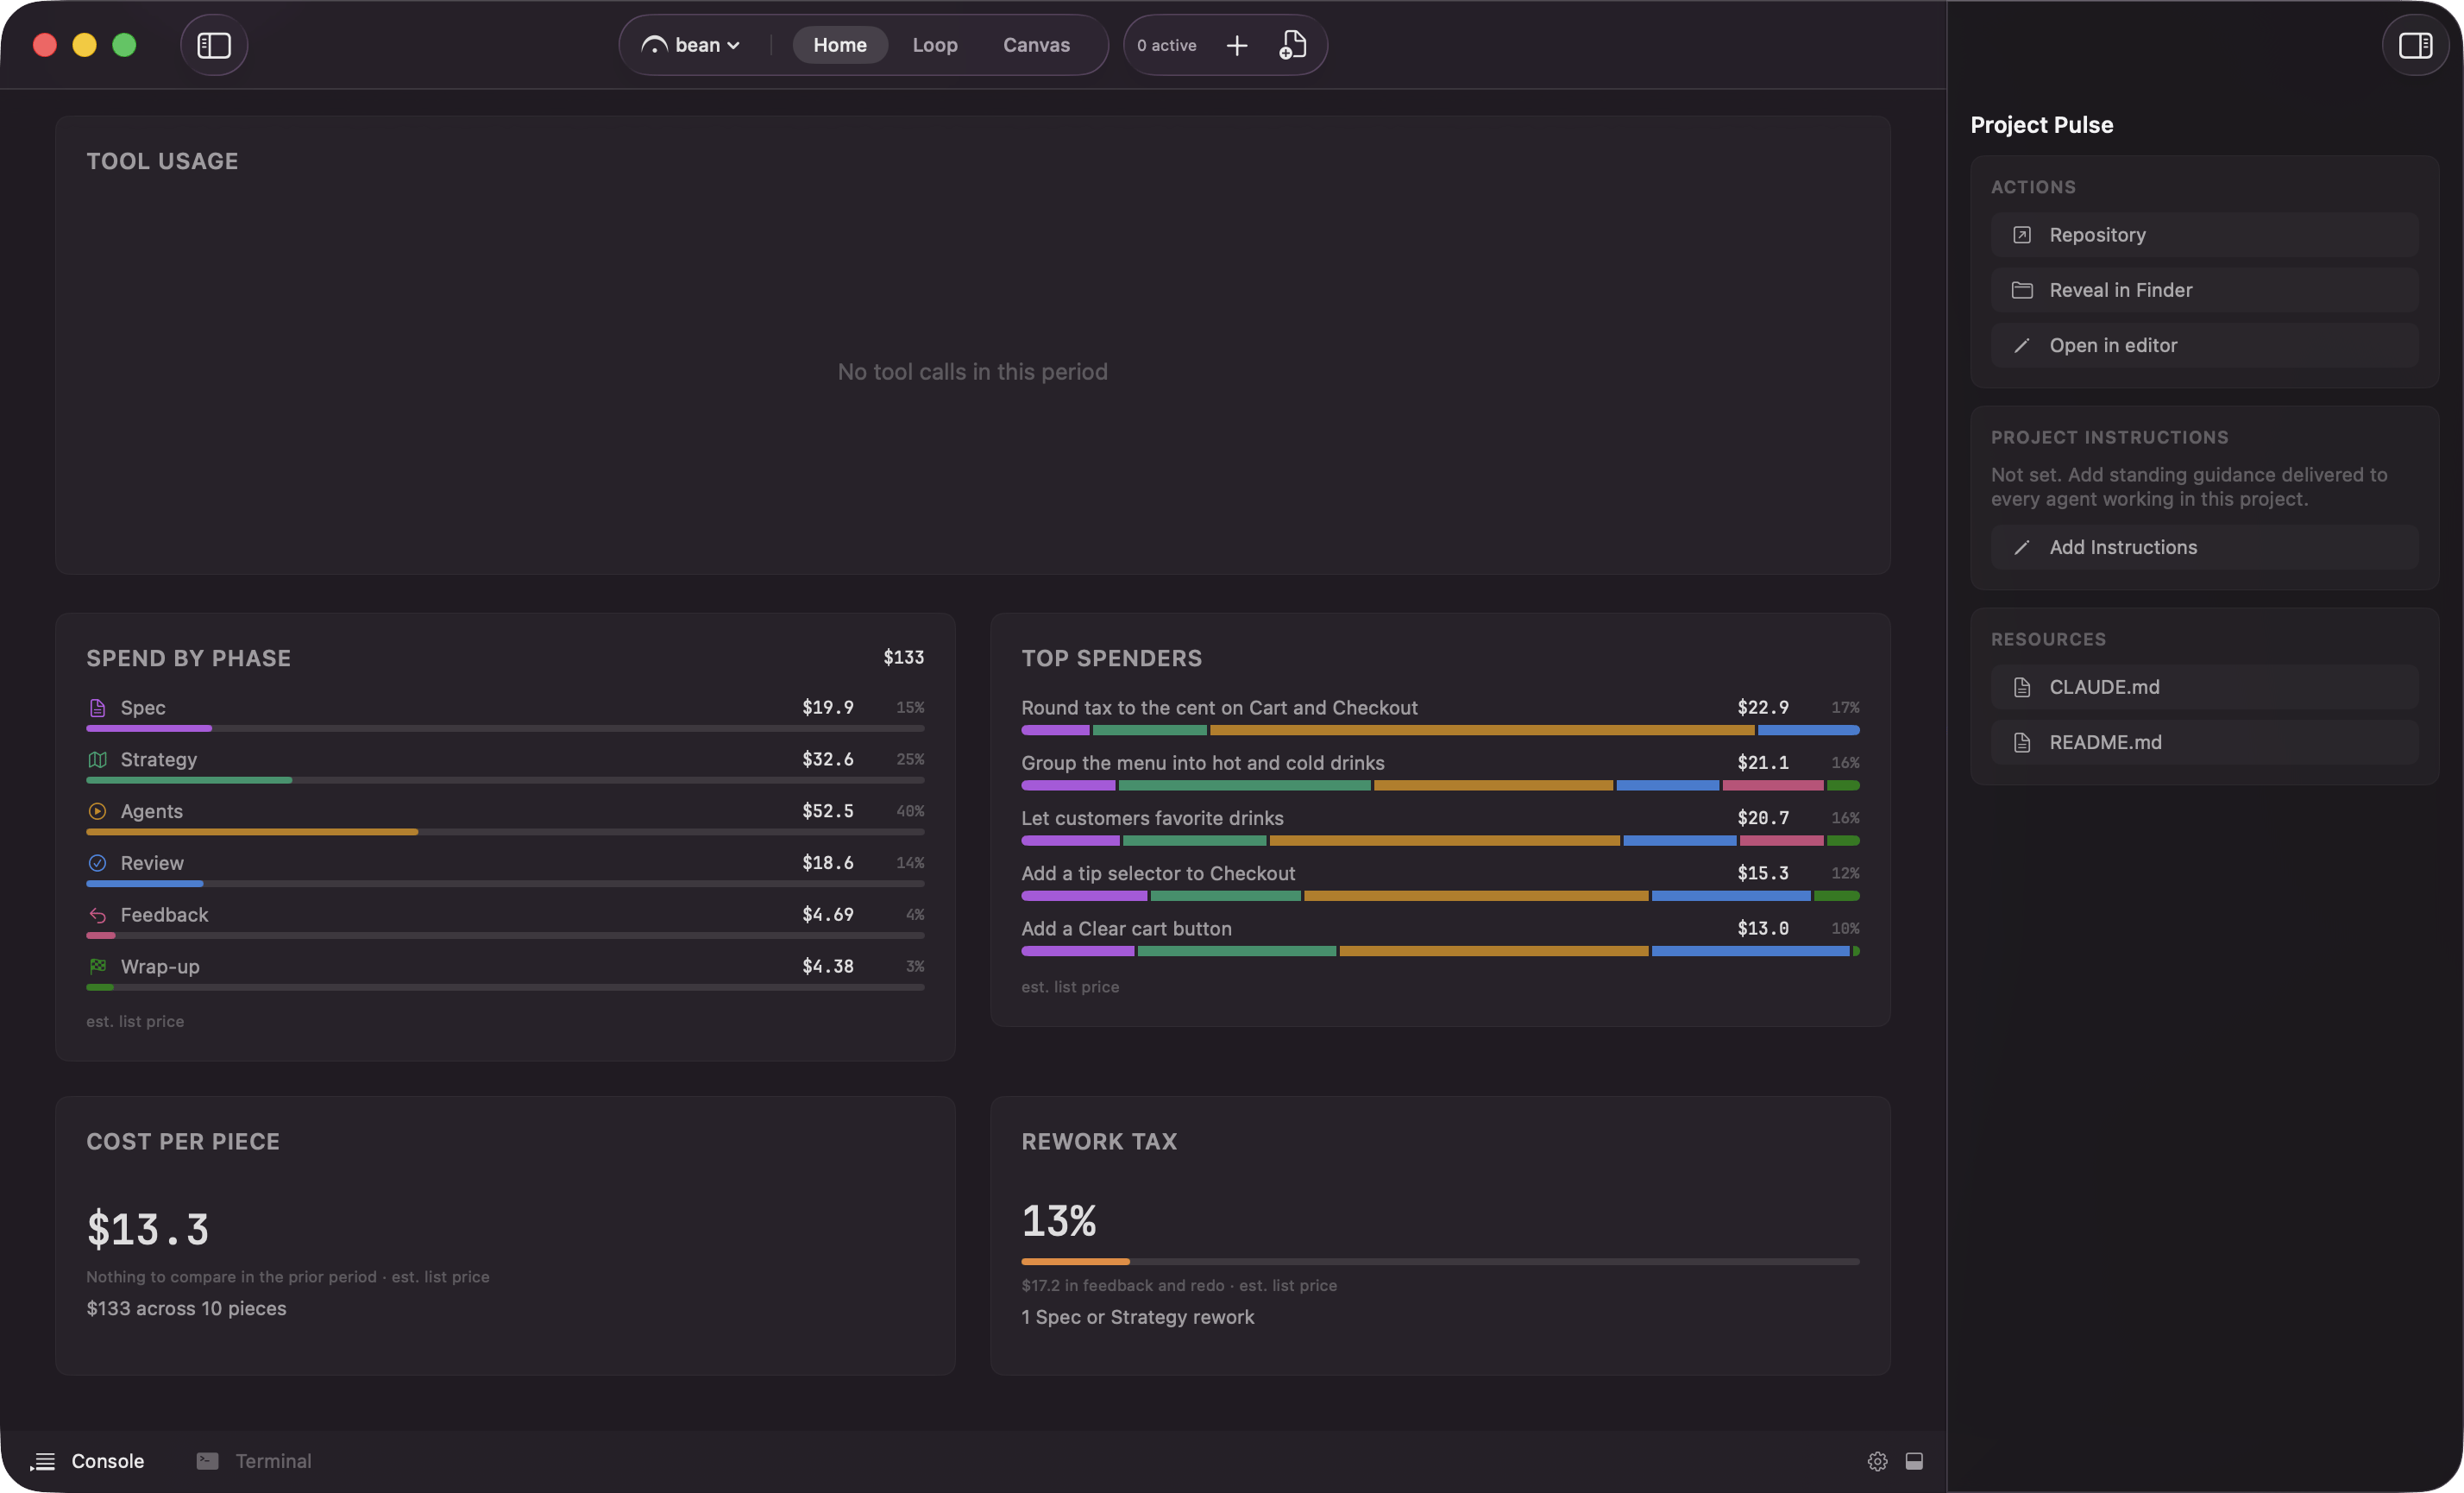 The four cards are gated by plan, not by [Edge](/configuration/edge): a Pro account sees them whether or not Edge previews are on. On Free the cards show locked, each carrying a Pro badge.
## Autonomy metrics
The "Autonomy" card reports how autonomous each run was: how much ran on its own versus where you stepped in. It splits the decisions into "Auto-handled" (allowed or blocked by a rule, without you), "Needed you", and "You denied", plus an autonomy ratio and interventions per session. This is the direct read on the promise that you supervise. It tells you, in numbers, how hands-off you actually were, and it is how you build the confidence to loosen the gates on the next piece.
## Where the data comes from
The numbers come from your own local Claude transcripts on your machine. This is not a billing export. The dashboard is computed locally and is never uploaded; per-session totals travel only if you pair a phone (see [privacy and data](/reference/privacy)). Fermata reads the transcripts the CLI already writes and turns them into a per-project view.
The analytics work the same whichever [model or provider](/configuration/models) you run, because they read what happened rather than what a vendor decided to bill you.
The four cards are gated by plan, not by [Edge](/configuration/edge): a Pro account sees them whether or not Edge previews are on. On Free the cards show locked, each carrying a Pro badge.
## Autonomy metrics
The "Autonomy" card reports how autonomous each run was: how much ran on its own versus where you stepped in. It splits the decisions into "Auto-handled" (allowed or blocked by a rule, without you), "Needed you", and "You denied", plus an autonomy ratio and interventions per session. This is the direct read on the promise that you supervise. It tells you, in numbers, how hands-off you actually were, and it is how you build the confidence to loosen the gates on the next piece.
## Where the data comes from
The numbers come from your own local Claude transcripts on your machine. This is not a billing export. The dashboard is computed locally and is never uploaded; per-session totals travel only if you pair a phone (see [privacy and data](/reference/privacy)). Fermata reads the transcripts the CLI already writes and turns them into a per-project view.
The analytics work the same whichever [model or provider](/configuration/models) you run, because they read what happened rather than what a vendor decided to bill you.