> ## Documentation Index
> Fetch the complete documentation index at: https://docs.fermata.run/llms.txt
> Use this file to discover all available pages before exploring further.
# Cost and usage
> What a piece cost, phase by phase, and how close your Claude account is to its plan limits.
Fermata runs on your own Claude setup and your own billing, so it keeps the money visible: what one piece cost, which phase spent it, and how close your account is to its plan limits. Every dollar figure Fermata shows is an estimate at list price computed from your local transcripts; it is never a bill. Subscription plans are not billed per token at all.
## The piece's Usage card
Every piece carries a "Usage" card in its inspector with three figures: "Cost", "Tokens", and "Sessions". Cost and tokens come from the transcripts of every run the piece made, cache and nested subagents included, and "Sessions" counts the sessions the piece spawned.
Under the cost sits the caption "est. list price". Hover it for the full caveat: "Estimated from per-model list pricing, including cache and subagent usage. Subscription plans are not billed per token, so this is an estimate, not a charge."
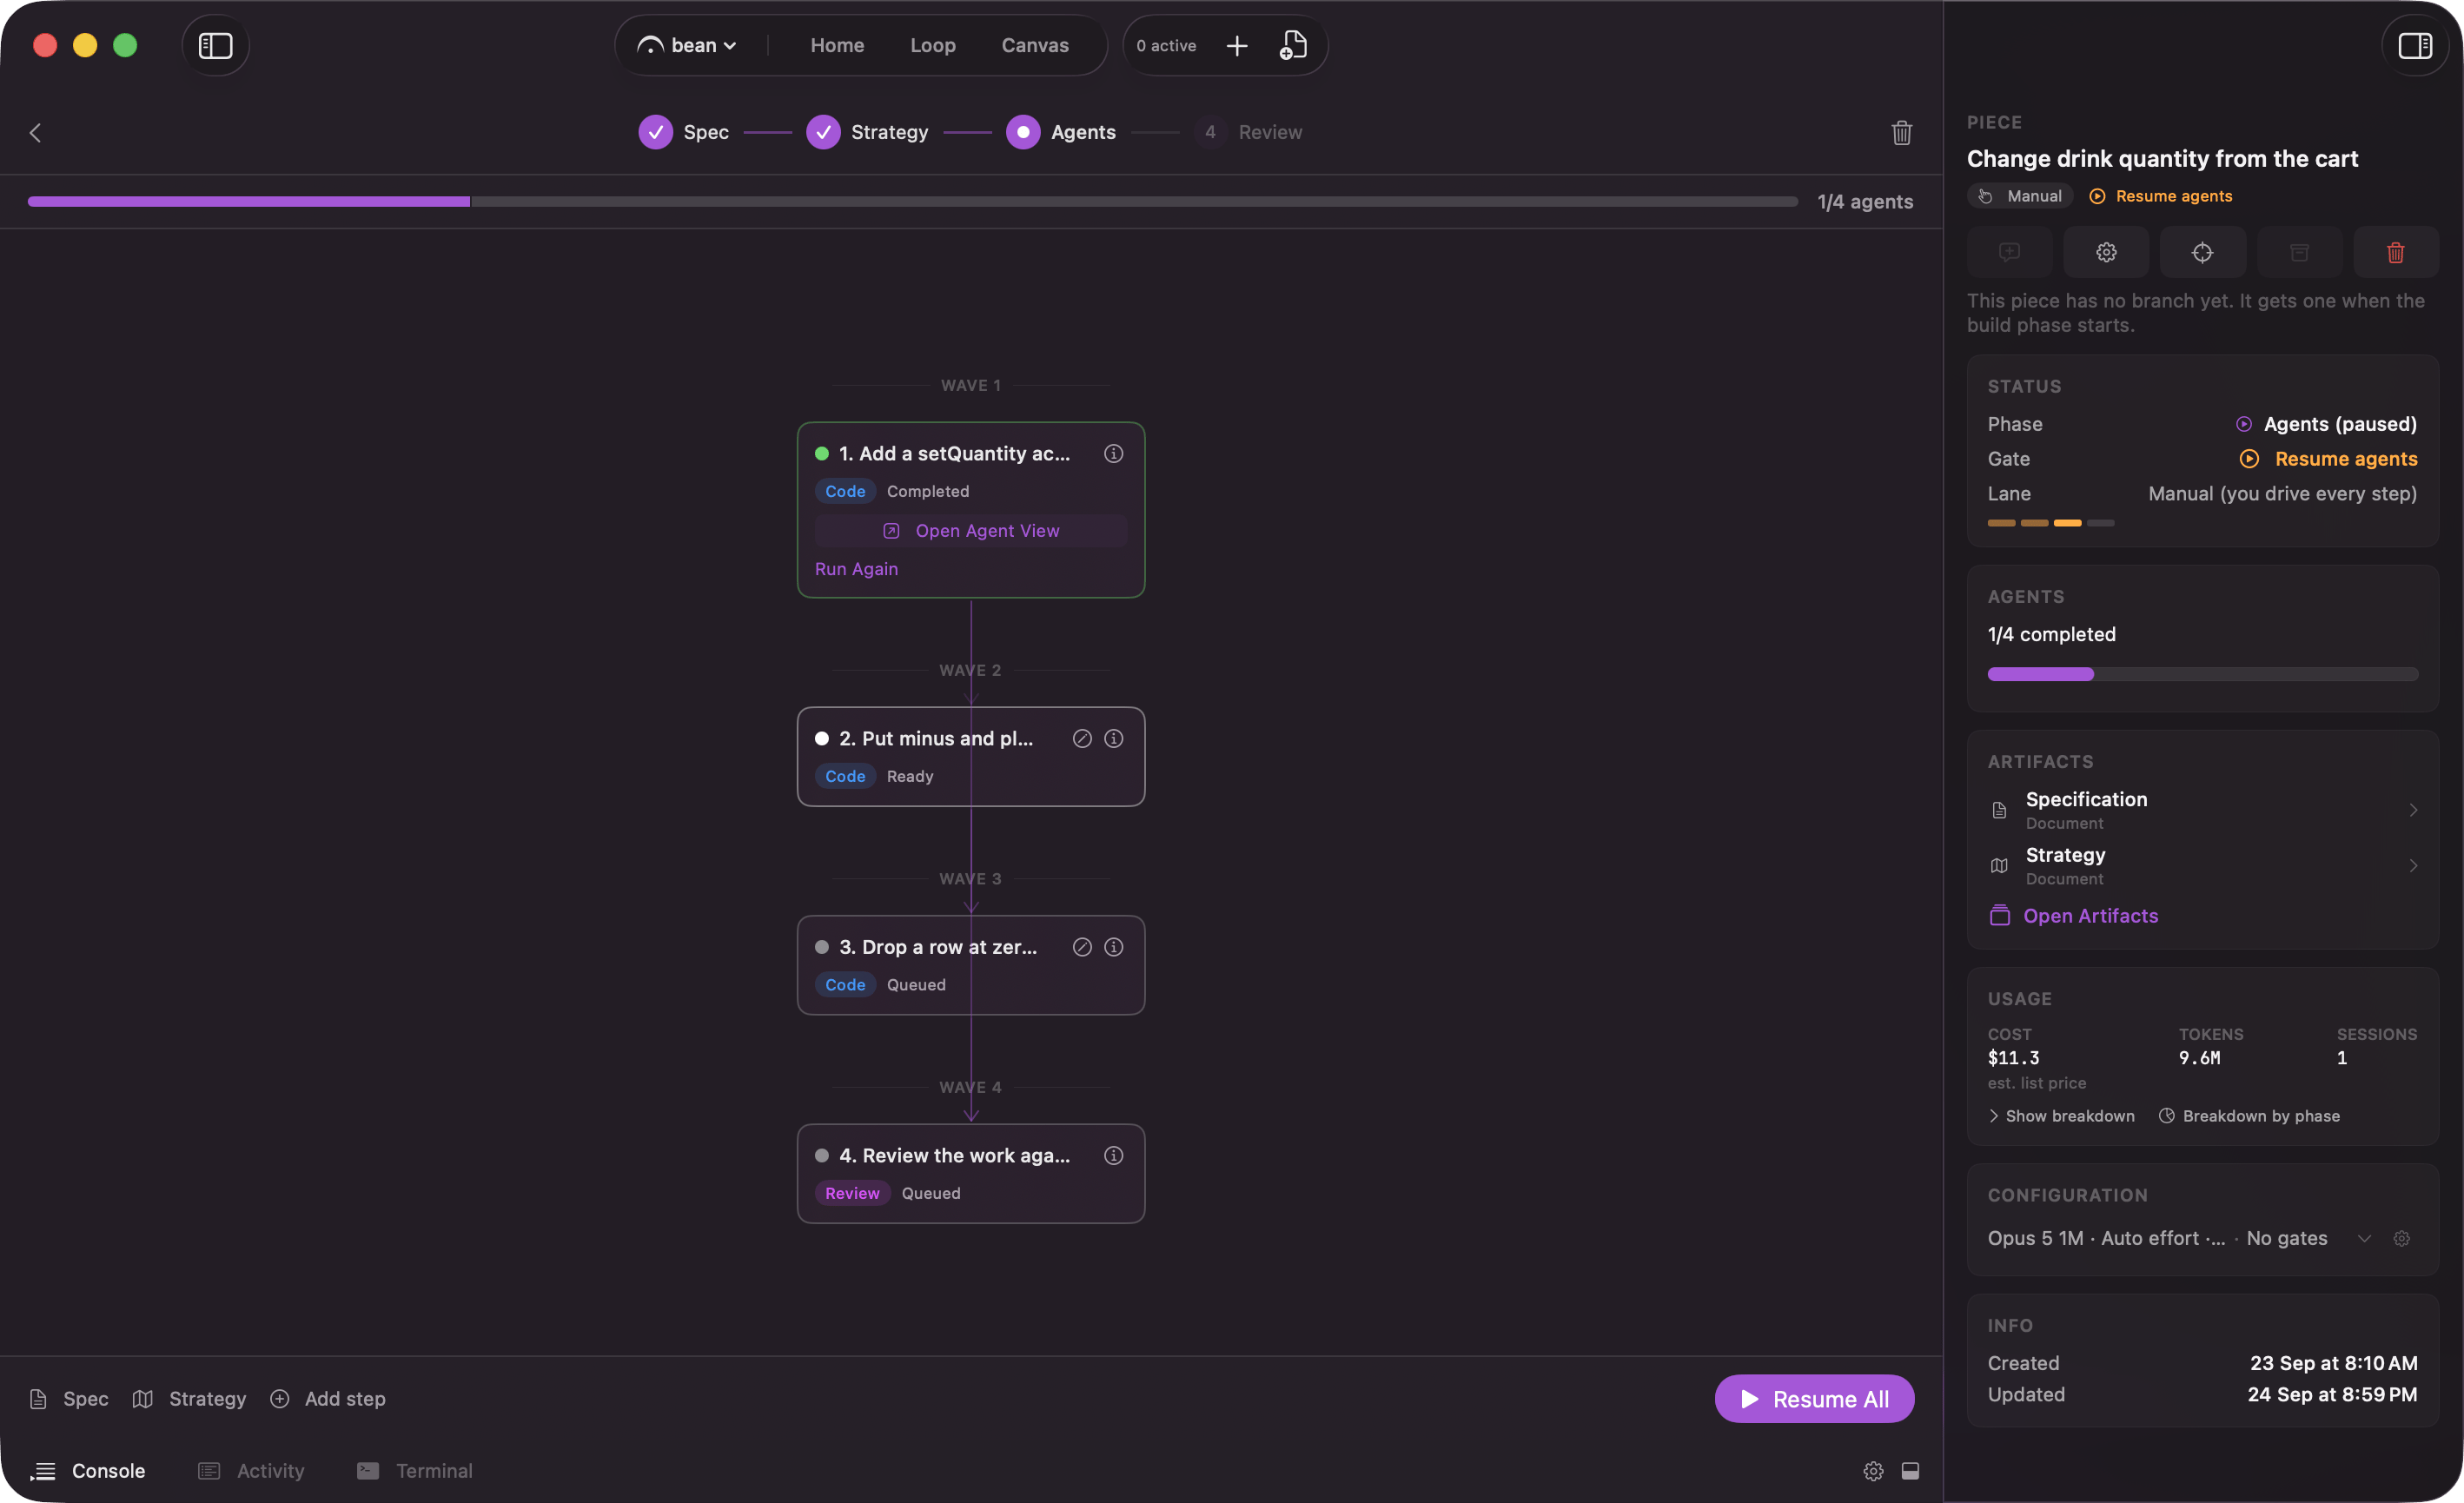 Two controls sit under the figures once the piece has transcripts to read:
* **Show breakdown** expands the token total into "Input", "Output", "Cache read", and "Cache write" rows.
* **Breakdown by phase** opens the "Spend by phase" sheet, described next.
## Spend by phase
The sheet is titled "Spend by phase" and opens with the piece's totals: "Total" (with the same "est. list price" caption), "Tokens", and "Runs". Below, the spend splits into lanes in the order the piece moved through them: "Spec", "Strategy", "Agents", "Review", "Feedback", "Wrap-up", and "Unattributed". Each lane row shows its share of the total, its tokens, and its cost; expand a lane to see the individual runs inside it, each named by its model. A run whose transcript has since been cleaned up reads "cost reported, transcript gone"; the figure survives the file.
Two controls sit under the figures once the piece has transcripts to read:
* **Show breakdown** expands the token total into "Input", "Output", "Cache read", and "Cache write" rows.
* **Breakdown by phase** opens the "Spend by phase" sheet, described next.
## Spend by phase
The sheet is titled "Spend by phase" and opens with the piece's totals: "Total" (with the same "est. list price" caption), "Tokens", and "Runs". Below, the spend splits into lanes in the order the piece moved through them: "Spec", "Strategy", "Agents", "Review", "Feedback", "Wrap-up", and "Unattributed". Each lane row shows its share of the total, its tokens, and its cost; expand a lane to see the individual runs inside it, each named by its model. A run whose transcript has since been cleaned up reads "cost reported, transcript gone"; the figure survives the file.
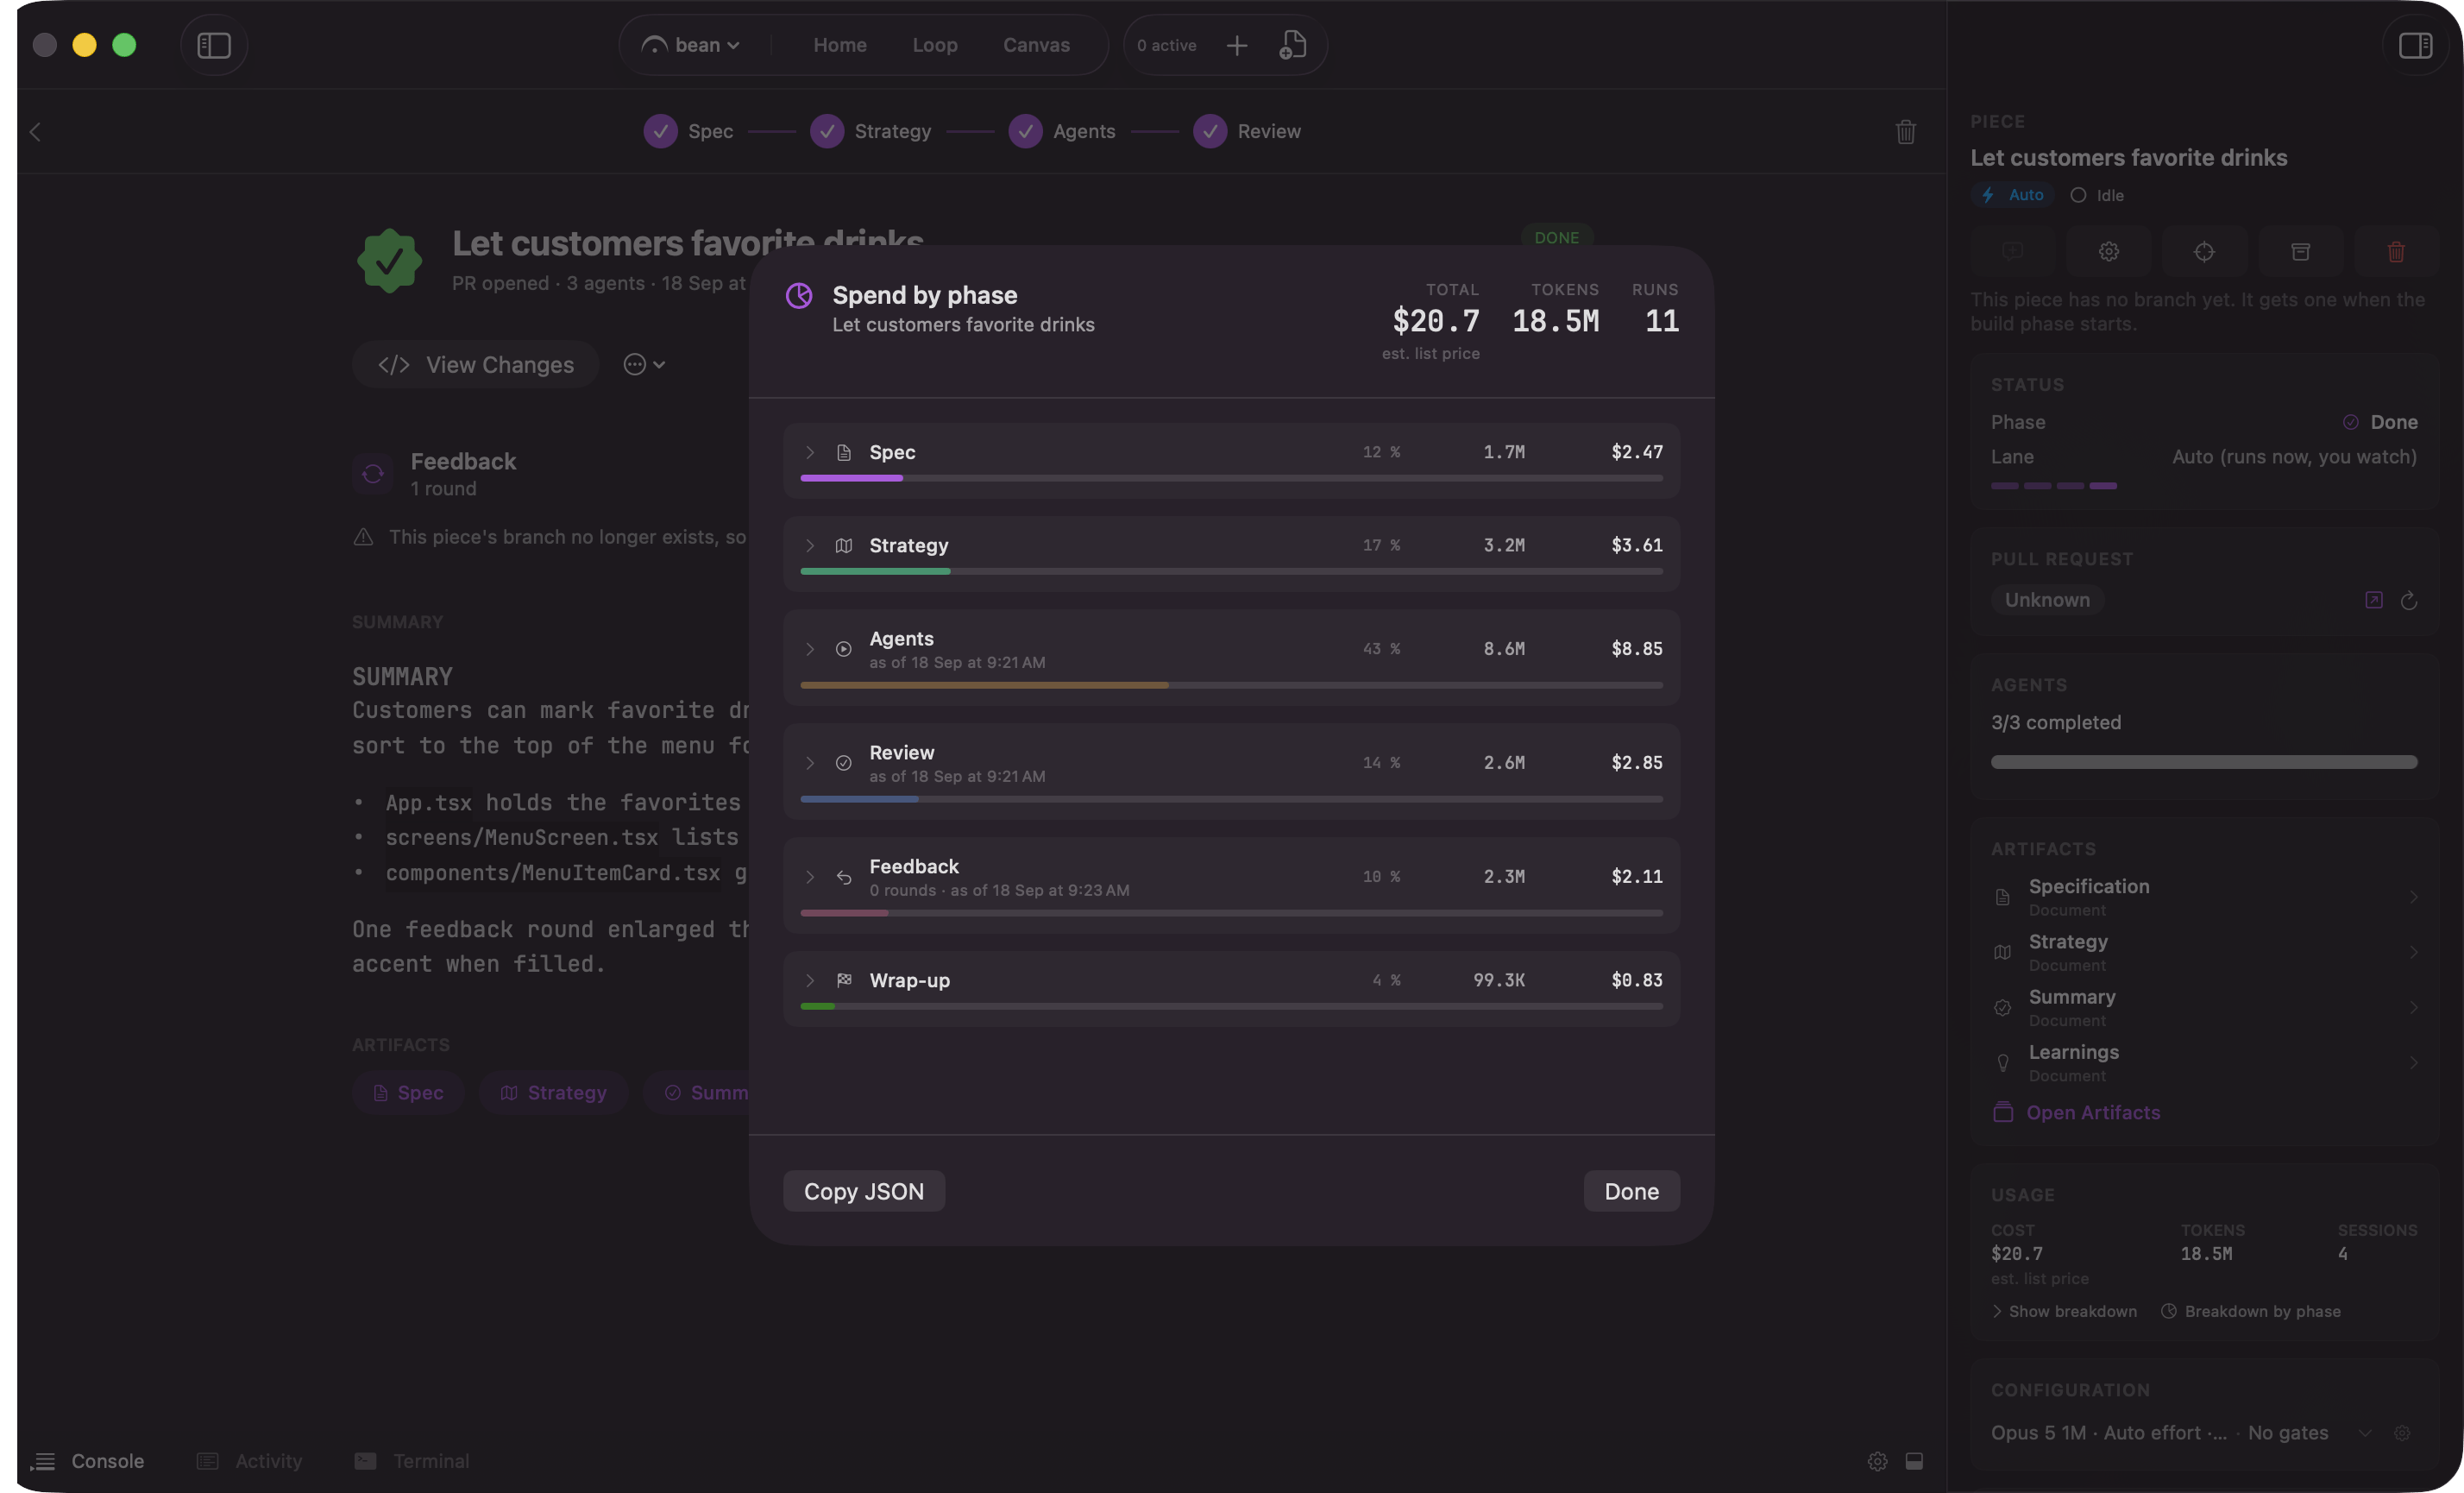 A few rows deserve a note:
* **"Feedback" carries the rounds.** Its second line counts how many times the piece was sent back, because the cost of rework means little without that number.
* **"Unattributed" is not an error.** It holds spend found in the piece's worktree that carries no phase: a manual chat you started there, and every run a piece made before per-phase tracking existed. On an older piece that row is most of the money, and the sheet says so rather than hiding it.
* **A lane the piece has moved past freezes.** Its figure is banked with an "as of" date and its meter draws dimmed; the number is real, it is simply no longer moving.
**Copy JSON** puts the whole split on the clipboard, nested runs and flags included. **Done** closes the sheet, and so does Esc.
## What counts toward a piece's cost
Everything the piece ran, not just its agents: the spec interview, spec assist, the judge and format passes, strategy generation, decomposition, the agents themselves, the work review, code review, and every rework session. The planning passes run in a shared reference worktree per project, and the rollup reads that directory too, so the thinking is counted alongside the building. This is why a piece's figure is honest about what the feature actually cost, and why the [cost ceiling](#the-cost-ceiling) can enforce a real budget rather than an agents-only one.
## Plan limits on Home
Two of [Home's](/surfaces/home) stat tiles read your Claude account's plan windows: "5-hour limit" and "Weekly limit". Each shows how much of the window is used, colored by the CLI's own severity, with a countdown to the reset. When the data goes stale the tile says so ("as of" a time) rather than pretending to be live.
A few rows deserve a note:
* **"Feedback" carries the rounds.** Its second line counts how many times the piece was sent back, because the cost of rework means little without that number.
* **"Unattributed" is not an error.** It holds spend found in the piece's worktree that carries no phase: a manual chat you started there, and every run a piece made before per-phase tracking existed. On an older piece that row is most of the money, and the sheet says so rather than hiding it.
* **A lane the piece has moved past freezes.** Its figure is banked with an "as of" date and its meter draws dimmed; the number is real, it is simply no longer moving.
**Copy JSON** puts the whole split on the clipboard, nested runs and flags included. **Done** closes the sheet, and so does Esc.
## What counts toward a piece's cost
Everything the piece ran, not just its agents: the spec interview, spec assist, the judge and format passes, strategy generation, decomposition, the agents themselves, the work review, code review, and every rework session. The planning passes run in a shared reference worktree per project, and the rollup reads that directory too, so the thinking is counted alongside the building. This is why a piece's figure is honest about what the feature actually cost, and why the [cost ceiling](#the-cost-ceiling) can enforce a real budget rather than an agents-only one.
## Plan limits on Home
Two of [Home's](/surfaces/home) stat tiles read your Claude account's plan windows: "5-hour limit" and "Weekly limit". Each shows how much of the window is used, colored by the CLI's own severity, with a countdown to the reset. When the data goes stale the tile says so ("as of" a time) rather than pretending to be live.
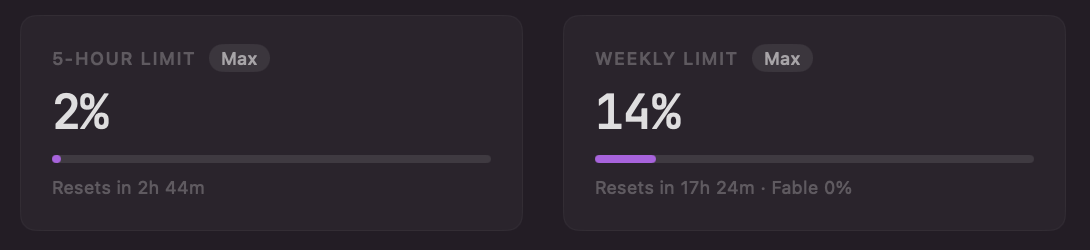 The numbers come from a short-lived probe: Fermata launches the Claude CLI, runs the handshake, sends one `get_usage` request, and exits. The probe never sends a user message, so it spends no tokens; it starts no MCP server, fires no hooks, and writes no transcript. It runs only while a visible window shows the tiles, refreshing every few minutes, and rate-limit events from your live sessions merge in between probes. Only Anthropic-hosted accounts report plan usage; the probe never runs against Bedrock, Vertex, or a gateway. [Privacy and data](/reference/privacy) covers what leaves your machine.
When the account reports no plan limits, or the provider has none to report, the two slots fall back to this project's last seven days: "Cost · 7 days" and "Tokens · 7 days", from the same data the [Analytics](/reference/analytics) tab reads.
## The cost ceiling
On Pro with [Edge](/configuration/edge) on, a piece's Flow Configuration sheet carries a **Cost ceiling (USD)** field in its "Limits" section; empty means "No limit". The caption under it states the contract: "The ceiling covers the whole Piece: planning spend counts toward it, not just the agents. The figure is an estimate at list price, not what you are billed."
When the piece's cumulative spend reaches the ceiling, the runner stops short of the next thing it was about to pay for and parks the piece. The Agents phase shows a red banner reading "Cost ceiling reached" with the spend against the limit, then: "No more agents will be spawned. The figure covers the whole Piece, planning included, and is an estimate at list price. Raise or clear the ceiling to continue." On the Loop board the card's chip reads "Cost ceiling reached" with the same two figures.
The numbers come from a short-lived probe: Fermata launches the Claude CLI, runs the handshake, sends one `get_usage` request, and exits. The probe never sends a user message, so it spends no tokens; it starts no MCP server, fires no hooks, and writes no transcript. It runs only while a visible window shows the tiles, refreshing every few minutes, and rate-limit events from your live sessions merge in between probes. Only Anthropic-hosted accounts report plan usage; the probe never runs against Bedrock, Vertex, or a gateway. [Privacy and data](/reference/privacy) covers what leaves your machine.
When the account reports no plan limits, or the provider has none to report, the two slots fall back to this project's last seven days: "Cost · 7 days" and "Tokens · 7 days", from the same data the [Analytics](/reference/analytics) tab reads.
## The cost ceiling
On Pro with [Edge](/configuration/edge) on, a piece's Flow Configuration sheet carries a **Cost ceiling (USD)** field in its "Limits" section; empty means "No limit". The caption under it states the contract: "The ceiling covers the whole Piece: planning spend counts toward it, not just the agents. The figure is an estimate at list price, not what you are billed."
When the piece's cumulative spend reaches the ceiling, the runner stops short of the next thing it was about to pay for and parks the piece. The Agents phase shows a red banner reading "Cost ceiling reached" with the spend against the limit, then: "No more agents will be spawned. The figure covers the whole Piece, planning included, and is an estimate at list price. Raise or clear the ceiling to continue." On the Loop board the card's chip reads "Cost ceiling reached" with the same two figures.
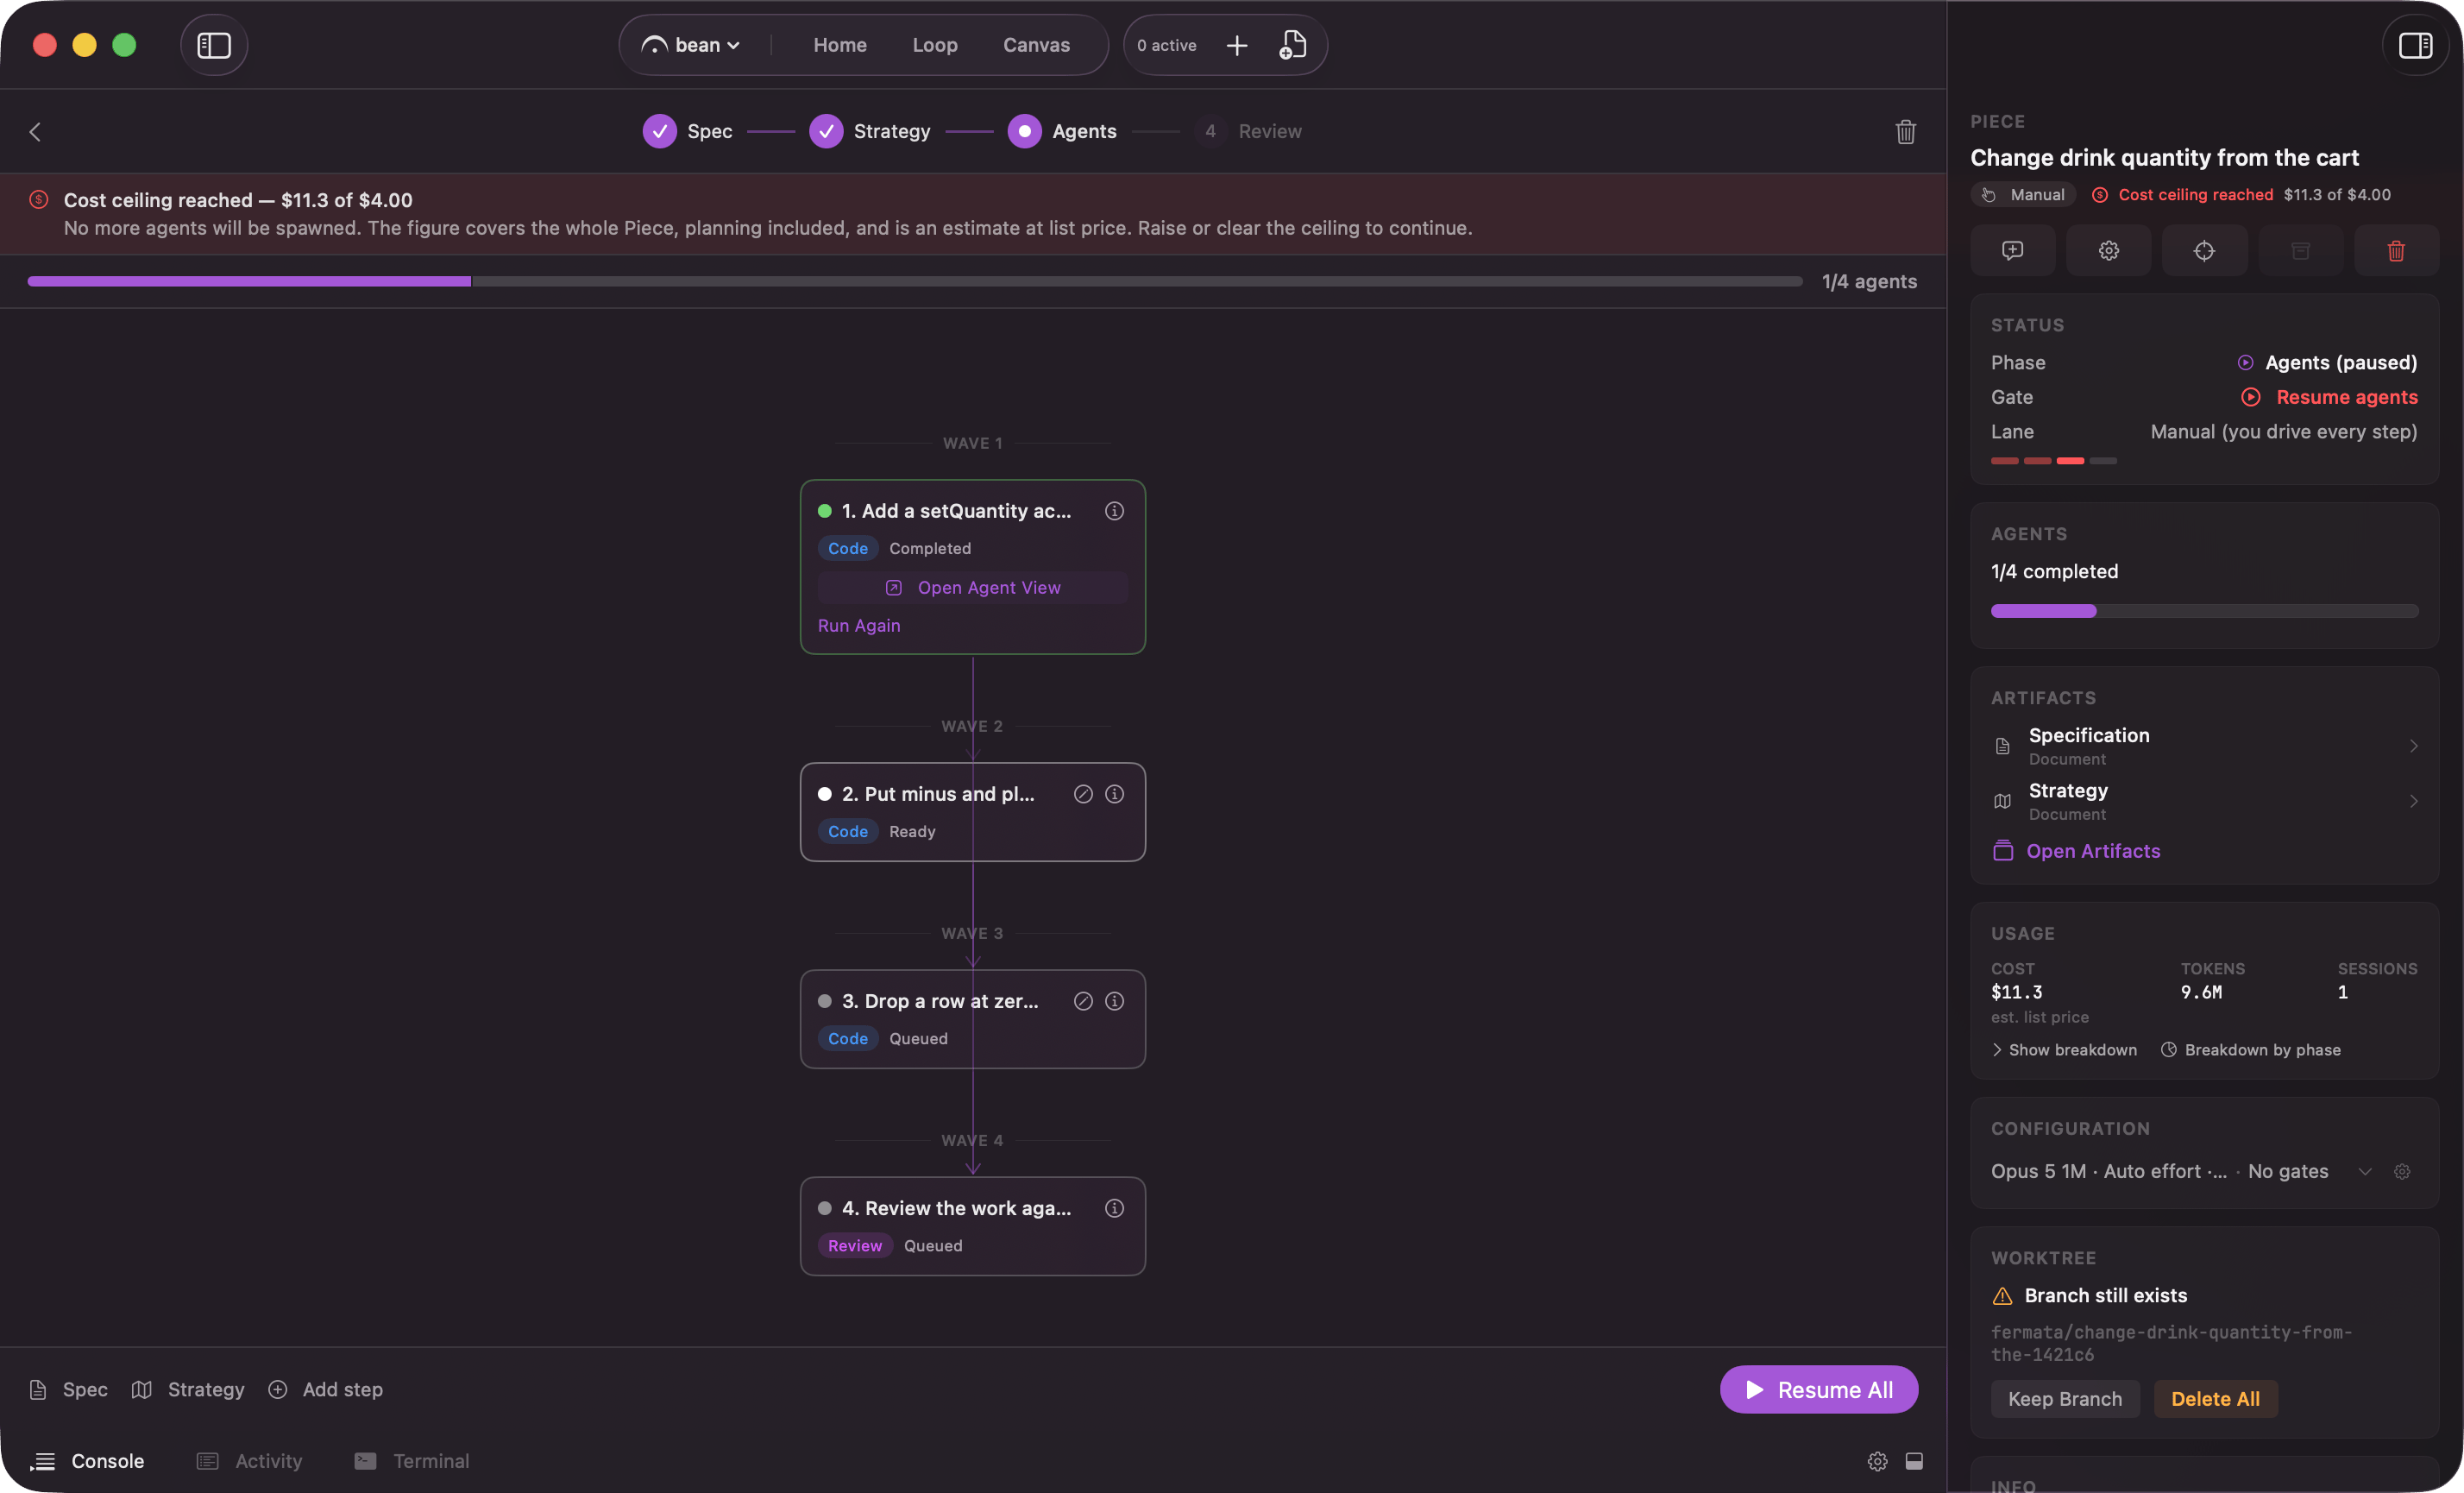 Nothing failed and nothing is lost. The piece is parked, not finished; raise the ceiling, clear it, or turn the feature off, and the run continues from where it stopped. [Limits](/loop/limits) covers where the field lives alongside the agent caps.
## Project analytics on Pro
Below the charts on Home's **Analytics** tab, Pro adds four spend cards for the whole project: "Spend by phase", "Top spenders", "Cost per piece", and "Rework tax". They are Pro, not Edge, and [project analytics](/reference/analytics) describes each one.
Nothing failed and nothing is lost. The piece is parked, not finished; raise the ceiling, clear it, or turn the feature off, and the run continues from where it stopped. [Limits](/loop/limits) covers where the field lives alongside the agent caps.
## Project analytics on Pro
Below the charts on Home's **Analytics** tab, Pro adds four spend cards for the whole project: "Spend by phase", "Top spenders", "Cost per piece", and "Rework tax". They are Pro, not Edge, and [project analytics](/reference/analytics) describes each one.