

Usage and mix
The dashboard reports over a time range you pick: Last 7 days, Last 30 days, or Last 90 days. Within that window it shows:- “Sessions run” and “Pieces completed”, each against the previous window.
- “Tokens”, “Cost”, and “Tool calls”. Cost is an estimate at list price, so a subscription plan is never billed that figure.
- “Activity”, the work per day over the window.
- “Models”, the token mix across the models you ran.
- “Tool Usage”, the breakdown by kind.
- “Autonomy”, covered below.
- “Spend by phase”. The project’s spend split across the same lanes as the piece sheet, Spec through Unattributed; lanes with no spend are omitted.
- “Top spenders”. Which pieces cost the most; a row opens that piece’s “Spend by phase” sheet.
- “Cost per piece”. What an average piece costs, and which way it is trending.
- “Rework tax”. What share of the spend went into feedback rounds and redo work.
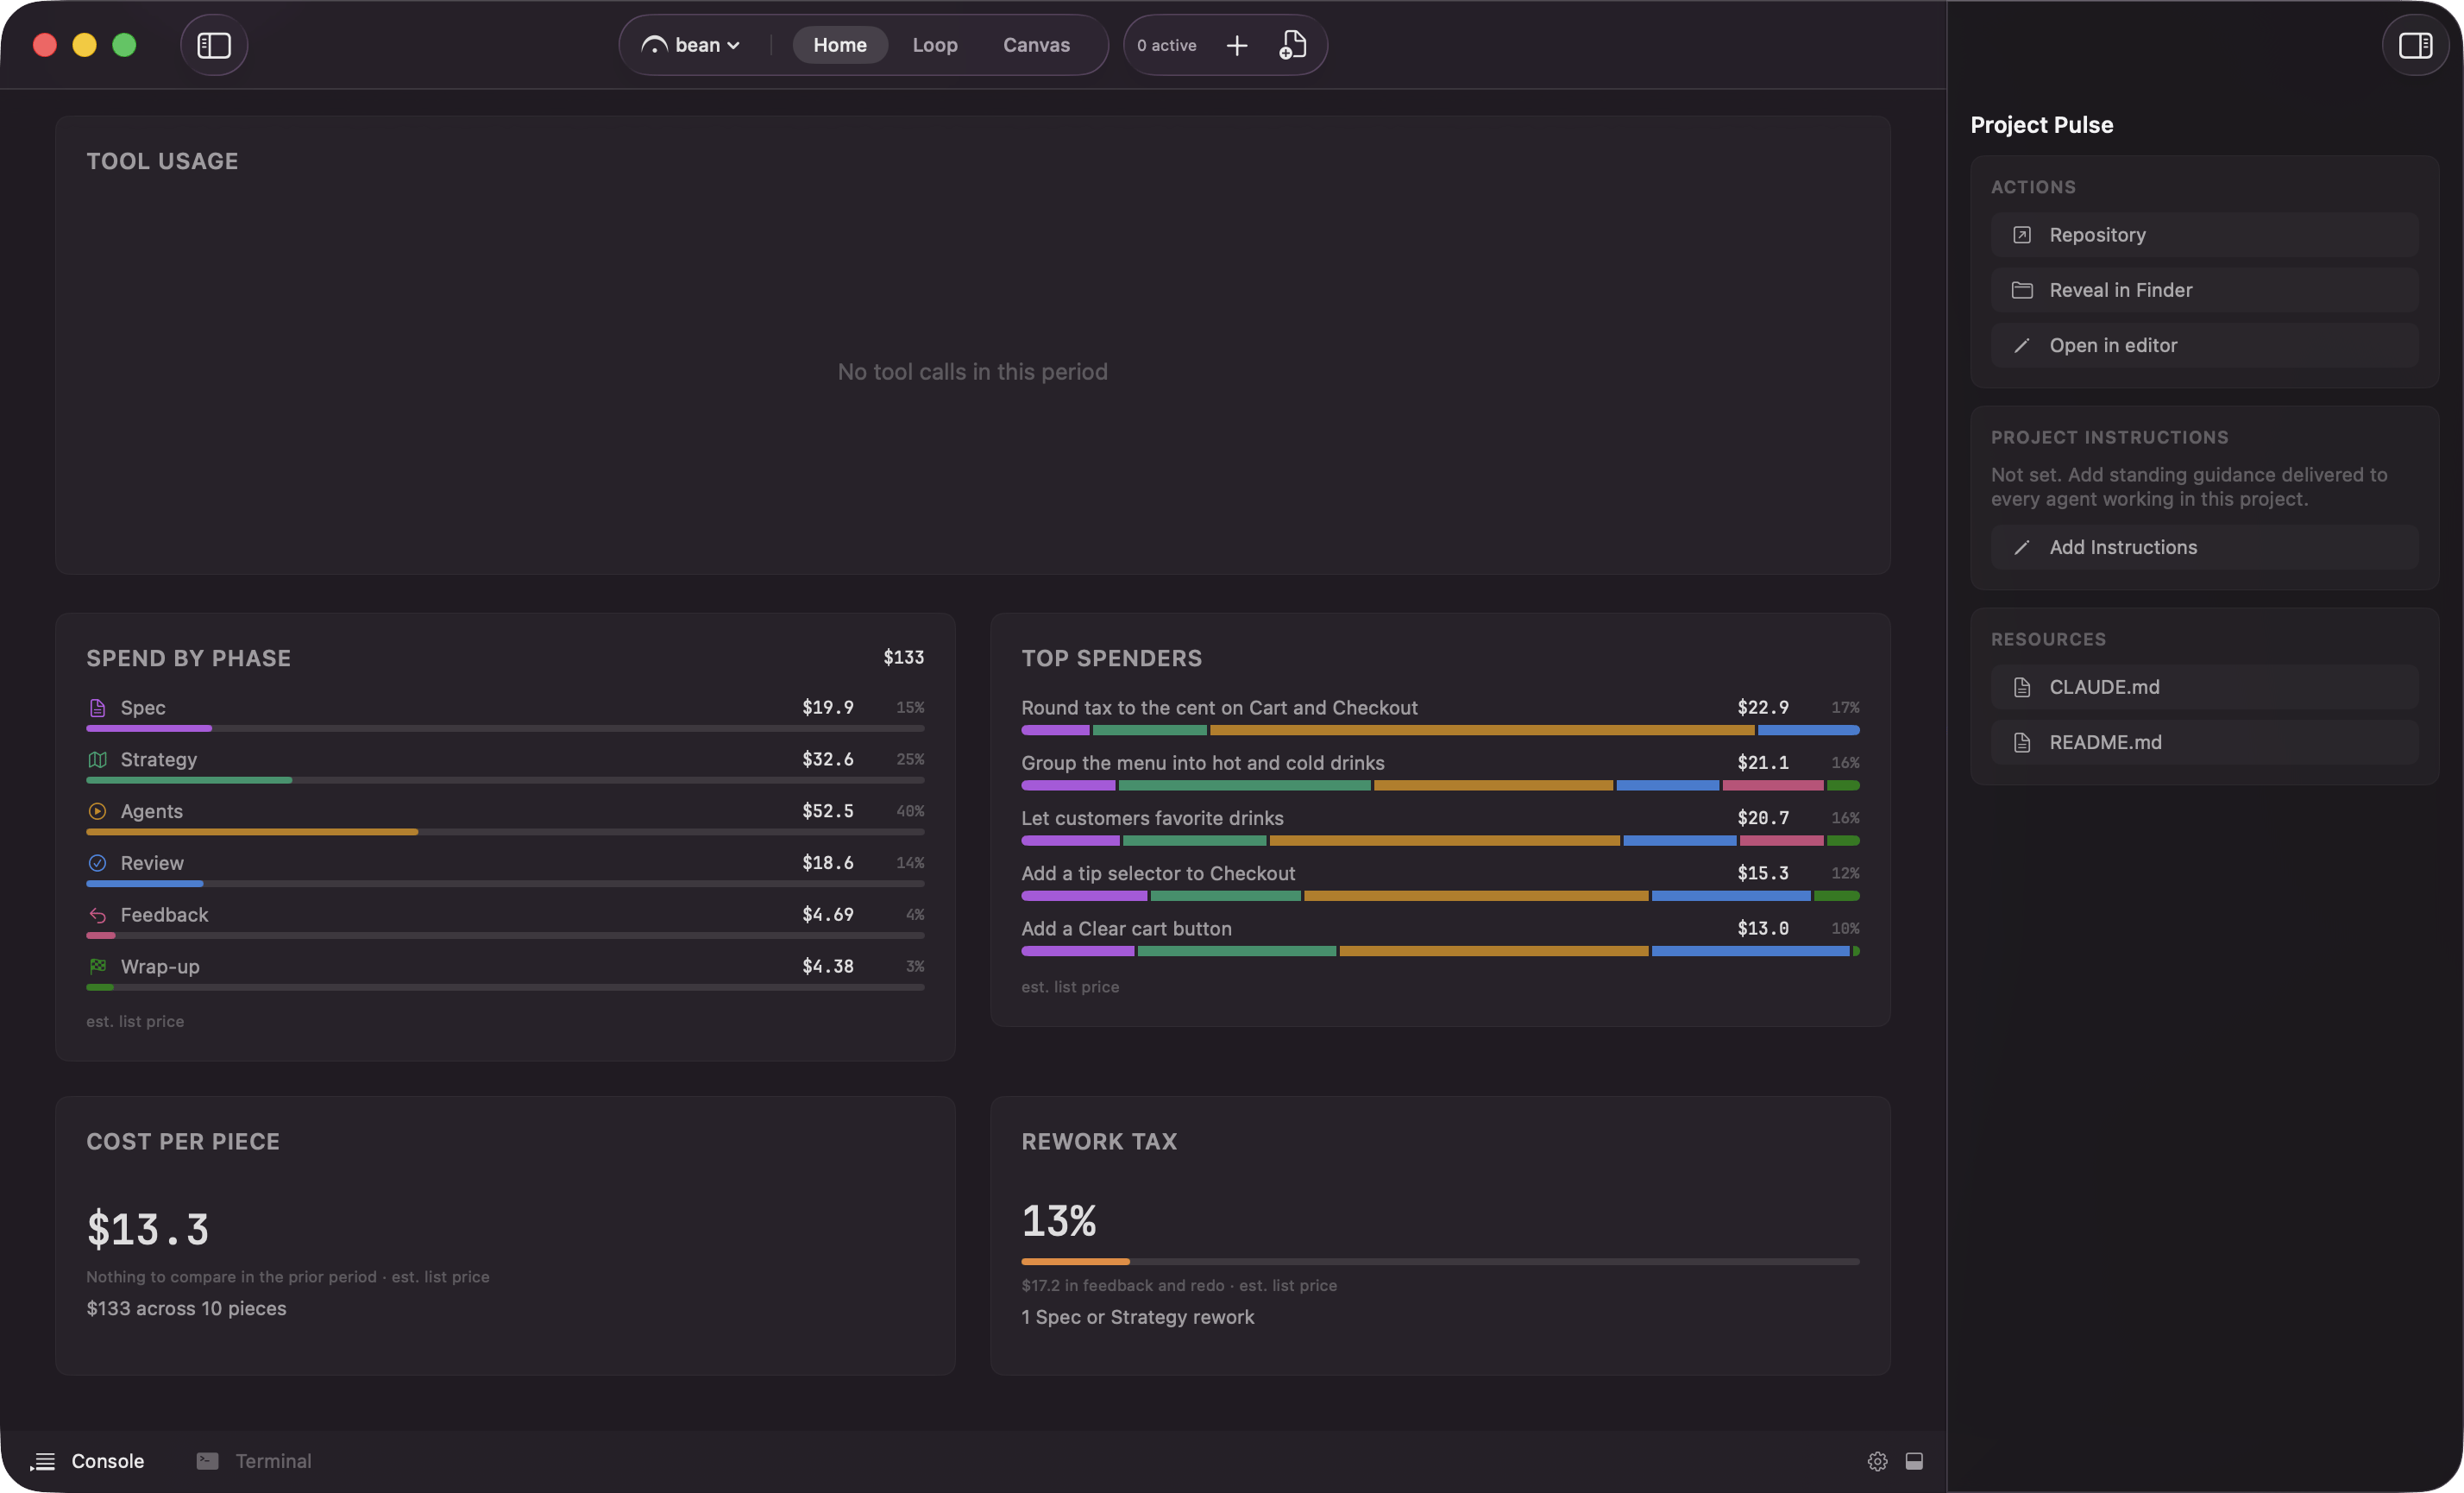
Analytics on Pro: Spend by phase, Top spenders, Cost per piece, and Rework tax under the charts