Home answers one question before anything else. What needs you? It is where a project opens, and it is the first of three chips in the window’s toolbar: Home, Loop, Canvas. Switching chips does not close a session, pause a run, or discard anything. The three are angles on the same project.
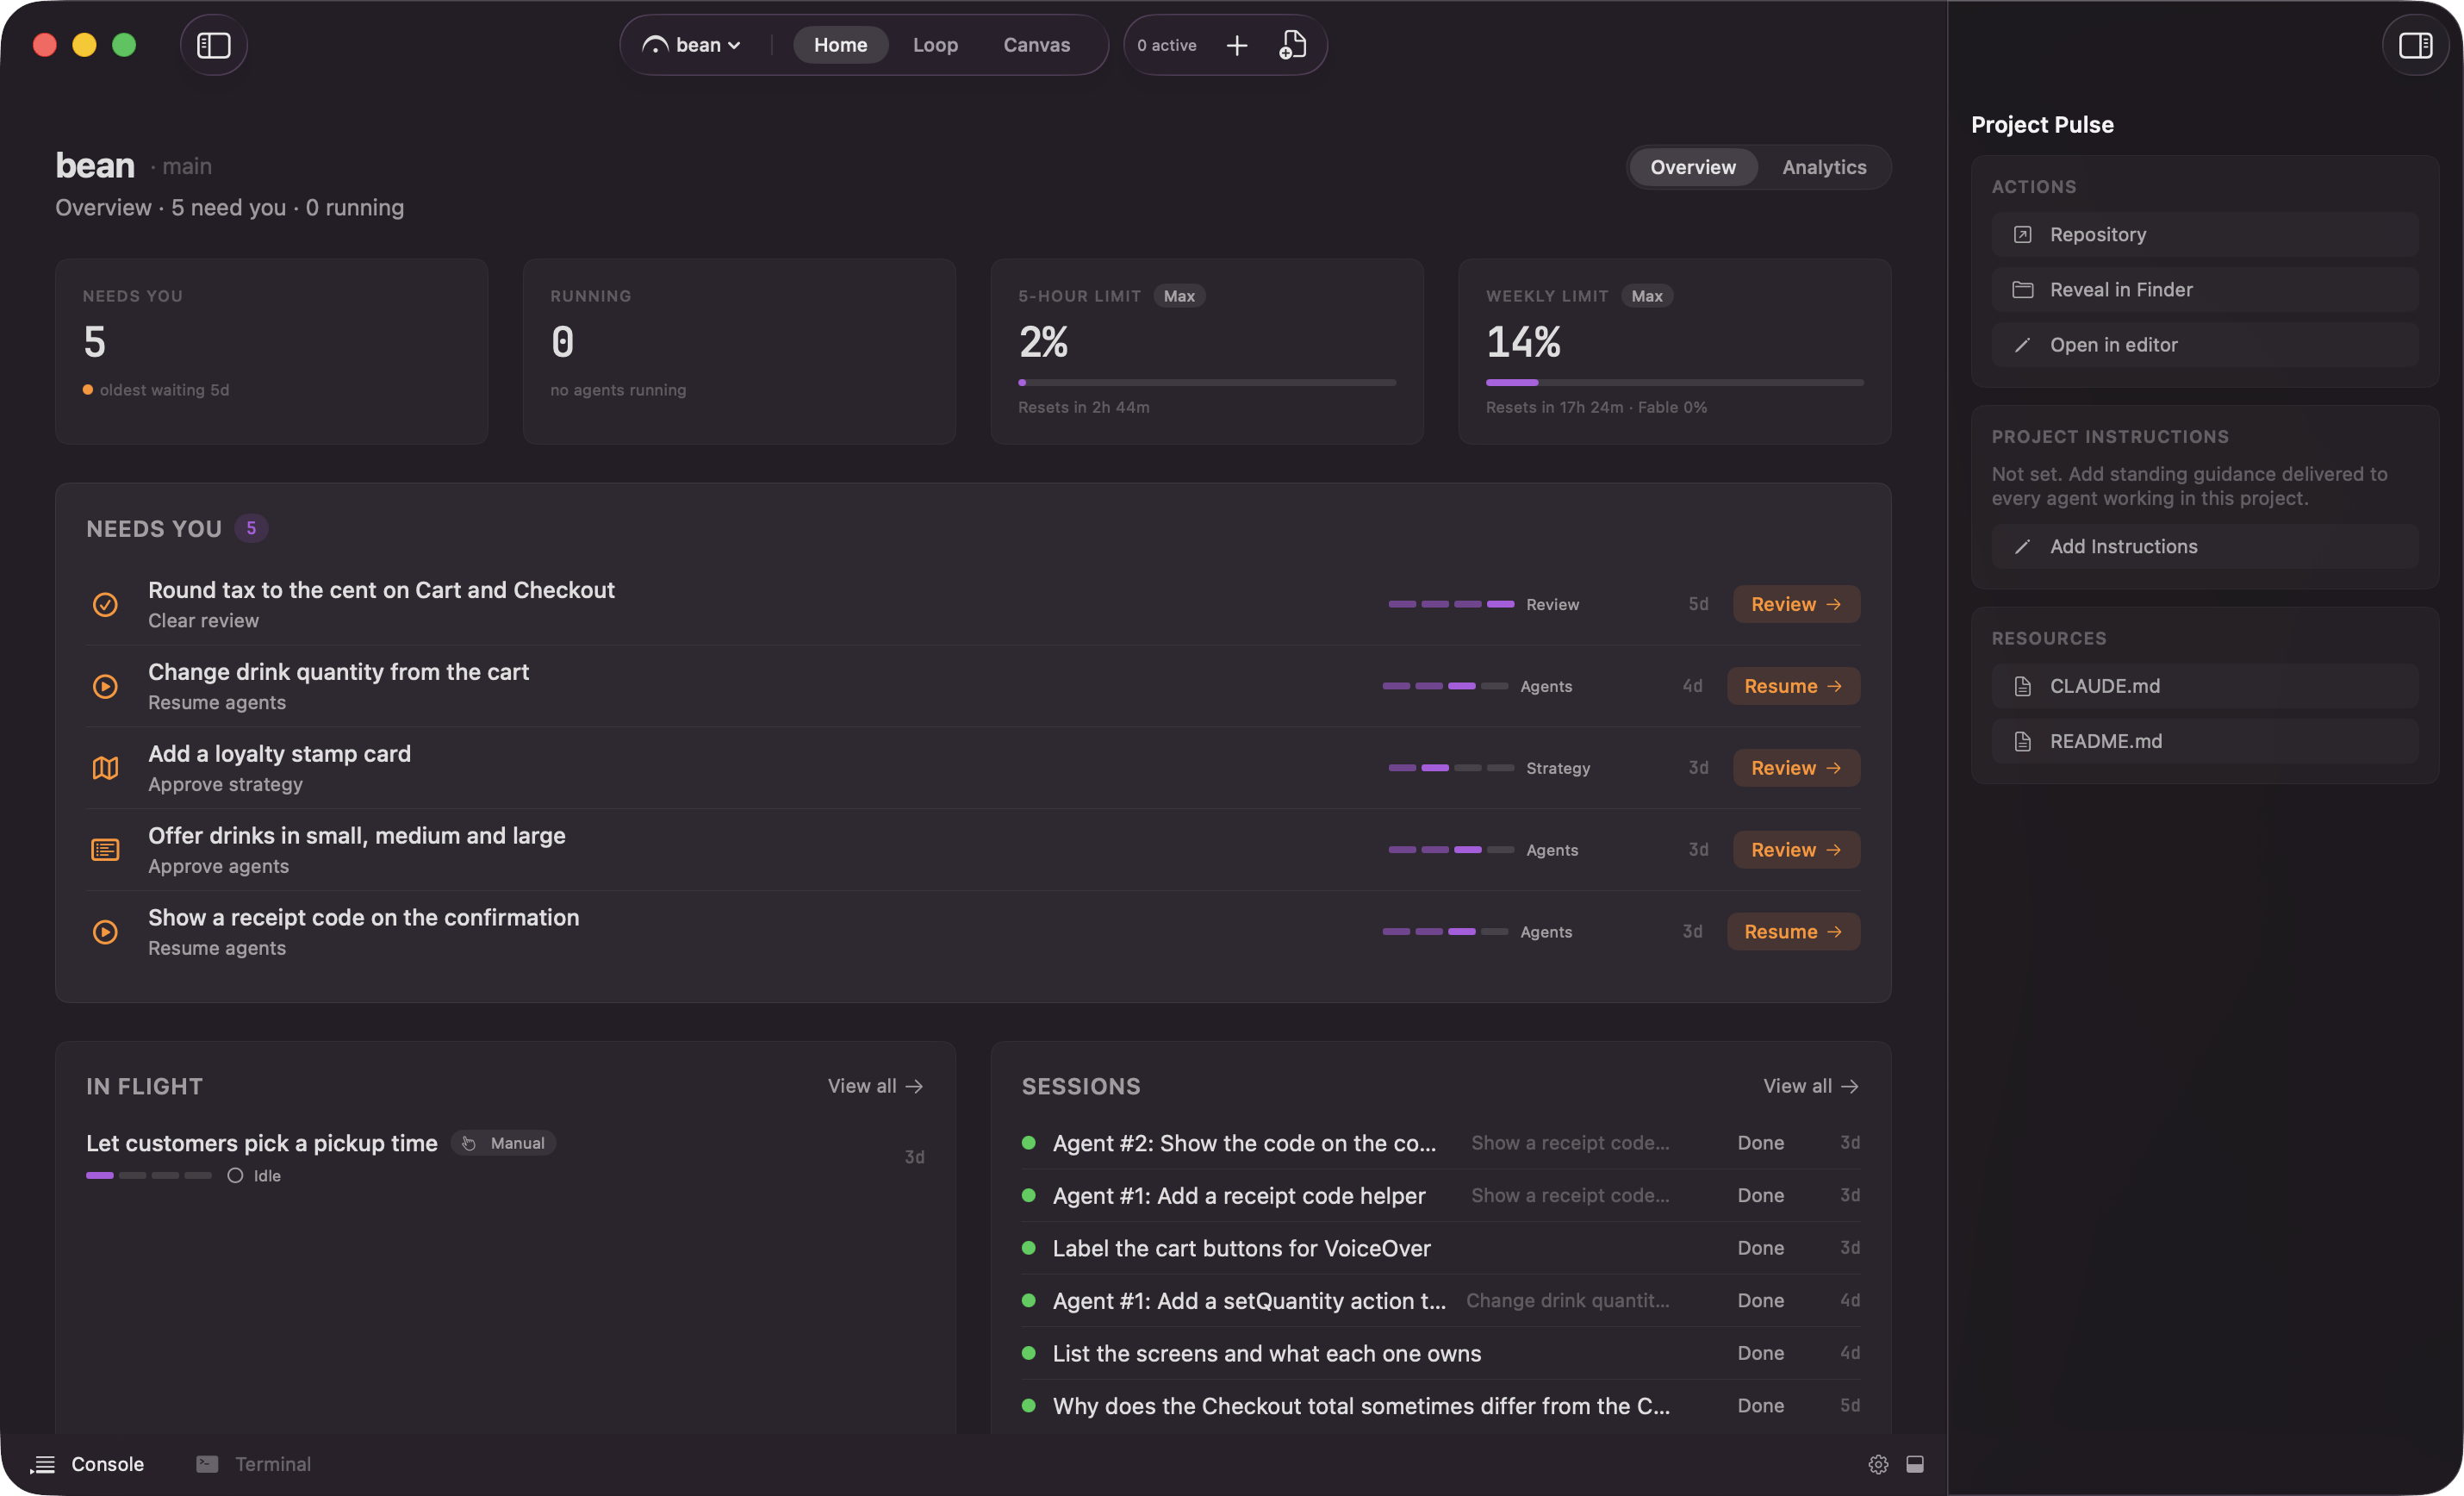
The Home surface with the stat tiles under the project name, a populated Needs You card beneath them, and the In flight and Sessions cards side by side below

Home: the stat tiles, then everything that needs you, oldest first

The layout is fixed whatever the project is doing: the header, a row of stat tiles, the full-width “Needs You” card, then “In flight” beside “Sessions”. Nothing reshuffles as work starts and stops, so your eye lands in the same place every time.

The header

The project name sits next to its current branch, and under them a one-line read of the project: “Overview · 2 need you · 3 running”, or “Overview · all clear” when both counts are zero. The two numbers are the same ones the first two tiles show, so the subtitle and the tiles never disagree.

The stat tiles

Four tiles in one row, wrapping to two rows on a narrow window.
  • “Needs you”. The count of rows in the “Needs You” card, with “oldest waiting 12m” under it while anything is waiting and “nothing waiting” otherwise.
  • “Running”. Every busy session in the project, including the interview and code-review sessions that do not appear as nodes, with the longest run’s age under it. It reads “no agents running” when idle.
  • The last two tiles, “5-hour limit” and “Weekly limit”, read from your Claude account: a percentage, a meter, and a countdown to the reset. On Bedrock, Vertex, or a gateway, or when the account reports no limits, the same two slots show “Cost · 7 days” and “Tokens · 7 days” for this project instead. The cost is an estimate at list price, and the tooltip says so.
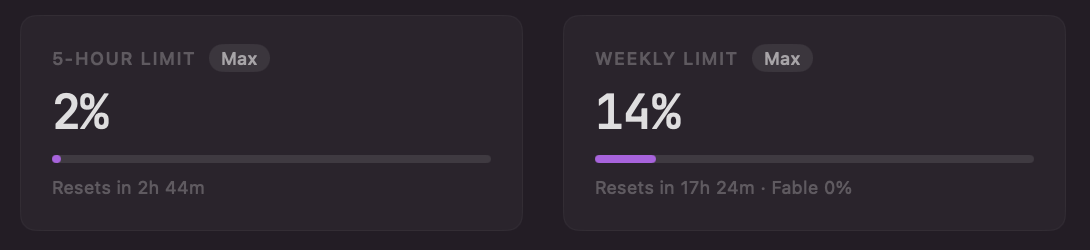
The Plan usage tiles on Home showing the 5-hour limit and Weekly limit, each with a percentage, a meter, and a countdown to the reset

Home stat tiles: 5-hour limit and Weekly limit read from your Claude account

Needs You

The full-width card, with a count badge when anything is waiting. Every row is something blocked on you. Pieces parked on a decision. Each row names the piece, the decision it is waiting for (approve the strategy, approve the agents, clear the review, create the pull request, resume the agents, retry the failed ones), and a chip carrying the verb: Review, Open, Resume, or Retry. A row for a review that found something says how many findings there are. Which of these stops a run hits is up to you, and that is the two layers. Sessions waiting on you. A session blocked on a tool approval reads “Approve Bash” or similar; a session waiting on a question reads “Waiting on your answer”. Both carry an Answer chip. A piece whose spec interview is waiting on your answer gets one row, for the piece. Failures. A failed session, and a spec interview that stopped before it finished, are rows too, each with an Open chip, so a run that died while you were away is listed rather than buried in the Canvas. Rows do not approve in place. Clicking one takes you to the surface that owns the decision, the piece workspace or the session, where you can read the context before you answer. When there is nothing outstanding the card reads “All clear”. Under the blocked rows, a quieter “Ready to finish” band lists the pieces that have completed every phase and are waiting for you to confirm them. Each reads “Ready to merge · PR #42” or “All phases complete · 4 agents”, with a Finish chip. A parked gate and an MCP confirmation never expire; the piece waits until you answer. A tool approval is the one thing with a clock: the Claude Code hook that raises it holds the call for 24 hours, and after that the CLI stops waiting and carries on as if the hook did not exist. The two layers has that rule in full.

In flight

The pieces currently moving. Each row carries the piece’s name, its lane badge, a miniature of the four-phase rail, and what it is doing right now, so the row reads the same way a card on the board does. A piece with an agent graph shows its progress as done-out-of-total agents on the right; one that has not reached the agents yet shows how long it has been in its phase. View all opens the Loop board, where the same pieces are laid out column by column. An empty card reads “Nothing in flight” with a New Piece button beside it.

Sessions

The project’s most recent sessions, each row a status dot, the session name, the piece it belongs to if any, its state, and how long ago it ran. It reads “No sessions yet” with a New Session button until you start one. Click a row to open that session; View all goes to the Canvas, where every session lives. The same two actions live in the toolbar as New Piece (⌘I) and New Session (⌘N), whatever Home is showing.

The Analytics tab

Home has two faces, switched by the segmented pill in the header: Overview and Analytics. Analytics reports tokens, cost, model mix, tool calls, and how much of the work ran without you, per project, read from the Claude transcripts already on your disk. The cost of one piece, split by phase, is on that piece’s “Usage” card in the inspector. See analytics.